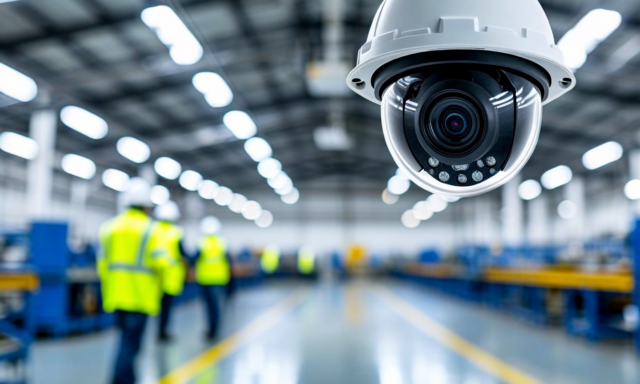
The commercial market for computer vision-based PPE compliance monitoring has matured significantly since 2021. The first generation of products, many of which were built on general-purpose object detection models retrained on small PPE datasets, generated enough false positives and missed detections to make them more trouble than they were worth in most manufacturing environments. The second generation, built on larger training datasets and deployed on improved edge hardware, has addressed many of those first-generation limitations - but not uniformly across all PPE categories.
For EHS managers evaluating computer vision PPE monitoring, the key insight is that detection reliability varies substantially by PPE type, lighting conditions, camera angle, and worker population characteristics. A system that performs well for hard hat and high-visibility vest detection in a well-lit assembly area may not perform adequately for glove detection or respiratory protection in the same environment. Understanding these reliability differentials before procurement saves significant operational cost compared to discovering them after installation.
The Reliability Hierarchy: What Computer Vision Can and Cannot Detect Reliably
PPE detection reliability has a consistent hierarchy across commercially available systems, which reflects the visual characteristics of different equipment types and the training data available for each category.
High reliability (>90% detection rate in appropriate conditions): Hard hats and high-visibility vests. Hard hats have distinctive shape profiles that are visually distinct from uncovered heads at a wide range of camera angles and distances. Class E and Class G hard hats in standard colors (white, yellow, orange, blue) are detected reliably by well-trained models. ANSI/ISEA 107-compliant high-visibility vests in Class 2 and Class 3 configurations, with their characteristic retroreflective striping patterns, are similarly distinctive. Detection reliability drops significantly for non-standard colors in either category - burgundy or brown hard hats used in some food processing environments, for example, are frequently missed by systems trained primarily on standard construction industry PPE colors.
Moderate reliability (70-85% detection rate): Safety glasses and face shields. Eyewear detection is reliable at close camera-to-worker distances but degrades with distance and angle changes. Workers facing away from or at oblique angles to cameras present detection challenges for eyewear that do not exist for hard hats, which are visible from above and rear angles. Face shields are more reliably detected than safety glasses due to their larger visual profile, but detection accuracy depends heavily on shield color and transparency.
Low reliability (<65% in standard manufacturing conditions): Gloves, hearing protection, and respiratory protection. These categories present the most detection challenges. Work gloves in a manufacturing environment are frequently the same or similar colors to other objects in the scene - tools, parts, surfaces - making reliable detection at the distances and angles typical of plant floor cameras technically demanding. Hearing protection is small enough and often obscured by head position that detection rates are insufficient for compliance monitoring purposes in most commercial systems. Respiratory protection - half-face and full-face respirators - is reliably detected only at close range with direct facial camera angles, which are rarely available in general plant floor camera deployments.
Lighting Conditions: The Variable That Most Vendor Demos Ignore
Computer vision detection demonstrations are almost always conducted in favorable lighting conditions: evenly distributed ambient light, minimal glare, and consistent illumination across the monitored area. Manufacturing plant floors are rarely this cooperative. Common lighting challenges include:
High-contrast environments with bright windows or skylights adjacent to work areas create auto-exposure problems for cameras that cause workers in darker areas of the frame to be underexposed. PPE detection accuracy in underexposed regions drops to levels that make compliance monitoring unreliable. Facilities with significant daylighting variation throughout the day need systems that have been evaluated specifically under their lighting conditions across their full operational schedule.
High-bay facilities with metal halide or high-pressure sodium lighting, or facilities transitioning to LED, have flicker and color temperature characteristics that affect detection reliability for color-dependent PPE categories like high-visibility vests. Some older lighting systems operated at frequencies that create visual artifacts in standard 30fps camera footage. Systems intended for these environments need to be evaluated with the specific lighting infrastructure in place, not under laboratory conditions.
Dust, smoke, and steam in industrial environments create visibility challenges that vary throughout the shift. Foundry floors, certain metal fabrication environments, and food processing areas with steam-generating equipment have periods of significantly reduced visual clarity that affect detection reliability in ways that average-condition testing will not capture.
What to Ask Computer Vision Vendors Before Procurement
The questions most commonly omitted from vendor evaluations are the ones that reveal the actual performance of a system under the conditions in your facility rather than under demonstration conditions. A structured evaluation should include:
Request detection rate data broken down by PPE category, not aggregate accuracy figures. An overall accuracy of 92% that includes reliable hard hat detection combined with unreliable glove detection is not useful for a facility where gloves are the PPE category of highest concern. Require category-level performance data for the specific PPE types your hazard assessment requires.
Require a site evaluation in your facility before procurement, with the vendor's system operating on your camera infrastructure (or equivalent camera hardware) under your lighting conditions across a full shift. Evaluate detection rate and false positive rate separately - a system with few missed detections but high false positives creates alarm fatigue that destroys the program's operational utility.
Ask for reference contacts at manufacturing facilities in similar environments - same industry, similar lighting, similar PPE requirements - who have been operating the system for at least 12 months. Demo-stage performance and 12-month operational performance diverge significantly in computer vision systems because training data gaps that don't show up in controlled evaluation surface in production under the full range of plant conditions.
Ask explicitly about the system's false positive rate per camera per shift. A system with a 2% false positive rate operating across 50 cameras generates 1 false alert per camera per shift - manageable. The same rate across 50 cameras with 1,000 worker-presence detections per camera per shift generates 500 false alerts per shift, which supervisors will quickly learn to ignore.
Integration with EHS Management Systems: The Data Value Calculation
Computer vision PPE compliance data has its highest analytical value when integrated into an EHS management platform that can contextualize it against other safety data streams. A declining PPE compliance rate in a specific work zone means different things depending on whether it coincides with a supervisor change, a training lapse for workers in that zone, or a recent incident that might be suppressing compliance reporting rather than reflecting genuine improvement.
The SafeSiteX platform ingests PPE compliance rate data from connected computer vision systems and incorporates it as a leading indicator in the zone-level risk scoring model. PPE compliance trends are evaluated against near-miss data, corrective action status, and training currency for workers assigned to the zone to produce a composite risk signal that is more accurate than any single data stream. For EHS managers evaluating computer vision vendors, the integration API quality and data export format are as important as raw detection performance.
The Business Case for Starting With What Works
Given the reliability hierarchy described above, the most practical deployment strategy for computer vision PPE monitoring is to start with high-reliability categories in your highest-risk work zones. Hard hat and high-visibility vest monitoring in areas where head and struck-by hazards are the primary risk profile provides reliable data at reasonable cost. Expanding to lower-reliability categories as vendor technologies improve and as your facility develops the operational processes to act on compliance alerts builds the program in a sequence that generates value before it generates complexity.
The alternative - deploying across all PPE categories simultaneously in all monitored areas - typically results in a system that performs well for a subset of what it was purchased to do, generates high false positive rates for the rest, and creates supervisor fatigue that undermines the entire program within six months. As we discussed in our article on leading safety indicators, PPE compliance rate is a valuable leading indicator only when the underlying data is reliable. Unreliable PPE data integrated into a leading indicator framework produces misleading risk signals rather than actionable ones.
For a detailed discussion of how SafeSiteX integrates computer vision PPE compliance data into our incident prediction platform, contact our team at [email protected].